
BMI Calculator
Type your height and weight to find your Body Mass Index straight away. Works in metric and imperial. Your BMI, BMI Prime, Ponderal Index and healthy weight range appear the moment you finish typing. Nothing to submit and nothing to install.
How to Use This BMI Calculator
You do not need to know any formula or do any maths. Pick your unit system, type your measurements, and the result appears on its own. Here is what each part of the page does and why it is there.
Choose your units
Switch between Metric and Imperial at the top of the form. Metric uses centimetres and kilograms. Imperial uses feet, inches and pounds. You can switch at any time and the calculator keeps your result up to date. Most countries outside the United States use metric. Both options give the same accuracy.
Enter your measurements
Type your height and weight in the boxes. The result updates the moment you stop typing so there is nothing to submit. Age and biological sex are optional fields. They do not affect the BMI calculation itself but they appear in the text when you use Copy Results to share your numbers.
Read your six results
You get BMI, weight category, healthy range, ideal weight, BMI Prime and Ponderal Index in one place. A colour-coded card changes shade based on your category. A visual scale bar shows exactly where your BMI sits across the full range from underweight to severely obese.
Three features worth using
If you are of East or South Asian descent tick the checkbox near the top. This switches the calculator to use the WHO recommended thresholds of 23 for overweight and 27.5 for obesity. The standard cutoffs were set using data from people of European descent and tend to underestimate health risk for South and East Asian adults.
The waist circumference section lets you add one more measurement for a fuller risk picture. Belly fat is more dangerous than fat stored elsewhere in the body and a large waist can signal elevated risk even when your BMI looks normal.
Your last five calculations are saved in the Recent section below the result. Click any previous entry to reload those measurements instantly. This is useful if you track your BMI over time and want to see how your numbers are moving.
What BMI Is and How It Is Calculated
BMI stands for Body Mass Index. It has been used in medicine and public health since the 1970s as a fast, cost-free way to screen populations for weight-related risk. Understanding the formula makes the result easier to interpret.
Metric example
A person who is 180 cm tall and weighs 65 kg. Height in metres is 1.80. Squared is 3.24. Divide 65 by 3.24 and the BMI is 20.1 which sits comfortably in the normal range. BMI Prime is 20.1 divided by 25 which equals 0.80. Ponderal Index is 65 divided by 1.80 cubed which equals 11.1 kg per cubic metre.
Ideal weight range for 180 cm is approximately 59.9 to 81.0 kg.
Imperial example
A person who is 5 feet 10 inches tall and weighs 160 lbs. Total height is 70 inches. BMI is 703 times 160 divided by 70 squared which equals 23.0. BMI Prime is 23.0 divided by 25 which equals 0.92. Both sit in the normal range.
Ideal weight range for 5 feet 10 inches is approximately 129 to 174 lbs.
The formula was created by Belgian mathematician Adolphe Quetelet in the 19th century. It gained widespread clinical use in the 1970s when Ancel Keys validated its correlation with body fatness in large population studies. The WHO adopted it as the standard screening tool shortly after.
BMI uses only two measurements and cannot directly measure body composition. Despite this limitation it is in widespread use because it requires no specialist equipment and takes seconds. The WHO and national health agencies treat it as a first-level screening step rather than a definitive health measure.
What Is BMI Prime?
BMI Prime is a simple ratio that tells you at a glance how your BMI compares to the upper limit of the normal range. No need to remember where the boundary sits.
How to read your BMI Prime
A BMI Prime of exactly 1.0 means your BMI is precisely at the top of the healthy range. Below 1.0 means you are in the normal or underweight zone. Above 1.0 means overweight or obese. A BMI Prime of 1.15 tells you that your BMI is 15 percent above the healthy upper limit. This is more immediately meaningful than the raw BMI number alone.
BMI Prime categories
Below 0.74: Underweight
0.74 to 1.00: Normal Weight
1.00 to 1.20: Overweight
1.20 to 1.40: Obese Class I
1.40 to 1.60: Obese Class II
Above 1.60: Obese Class III
BMI Prime is particularly useful for comparing individuals whose healthy BMI thresholds differ. For example when using the adjusted thresholds for people of Asian descent. Because it always expresses BMI as a proportion of whatever upper normal limit applies it makes fair comparisons possible across different population groups.
What Is the Ponderal Index?
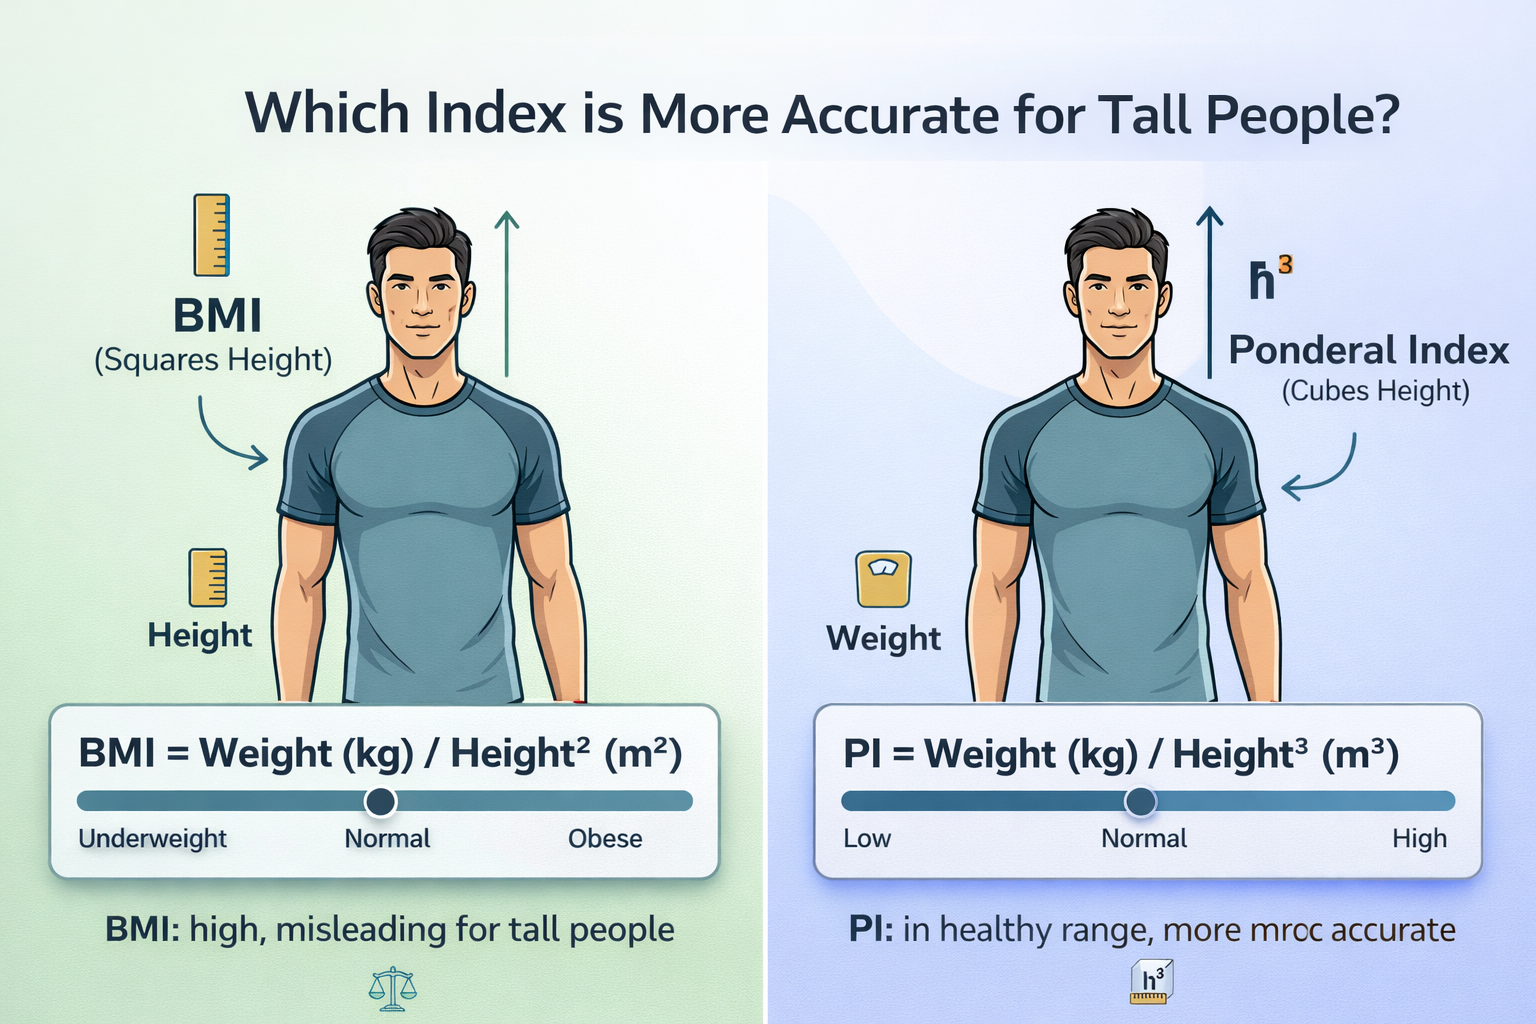
The Ponderal Index is an alternative to BMI that uses the cube of height rather than the square. It corrects a known weakness of BMI with very tall and very short individuals.
Where BMI Is Reliable and Where It Falls Short
BMI is genuinely useful in the right context. Knowing where it works well and where it misleads helps you decide how much weight to give your result.
Where BMI gives a reliable guide
BMI is a reasonable rough guide for adults between 18 and 65 who are not heavily muscular and do not have unusual body composition. It is particularly useful for tracking weight trends in the same person over time because any change in the number directly reflects a change in body weight.
At a population level BMI has been validated across thousands of studies. Groups of people with high average BMI consistently show higher rates of type 2 diabetes and high blood pressure and heart disease. The statistical relationship is solid even if it does not apply to every individual.
For a self-check before a doctor appointment it gives you a number you can discuss clearly and compare against published reference values.
Where BMI misleads
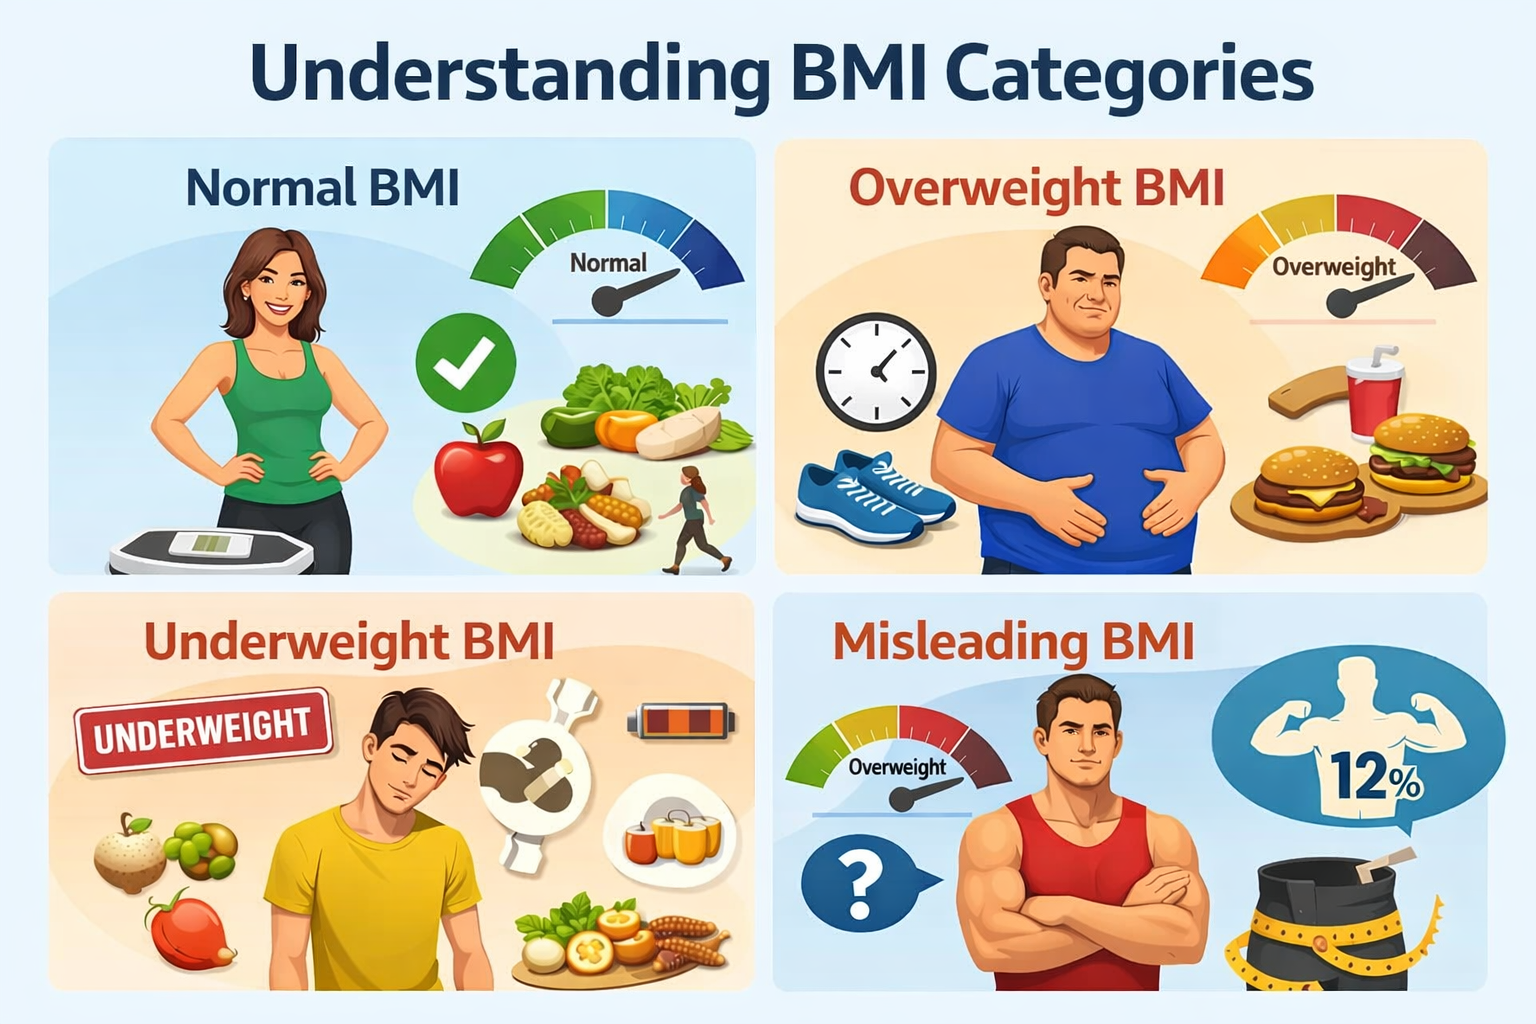
Athletes and people who lift weights regularly often show BMI readings in the overweight or obese range because muscle is considerably denser and heavier than fat. A professional rugby player at peak condition might carry a BMI above 30 without meaningful excess body fat.
Older adults frequently show a normal BMI while carrying more fat than the number suggests because muscle mass naturally declines with age. People who are very short or very tall can also receive misleading readings. This is where the Ponderal Index provides a more accurate cross-check.
The standard thresholds were calibrated primarily on populations of European descent. Adults of East and South Asian descent tend to carry higher body fat and face greater cardiometabolic risk at the same BMI which is why the WHO now recommends lower action points for these populations.
Better measures when BMI is not enough
Waist circumference above 94 cm for men or 80 cm for women signals elevated metabolic risk regardless of BMI. Waist to height ratio below 0.5 is a practical guideline that works across ethnic groups. Body fat percentage from a DEXA scan or bioelectrical impedance provides the most direct reading of body composition. The Ponderal Index calculated by this tool is a more accurate BMI alternative for people at height extremes. Use BMI as a starting point and these supplementary measures when you need more precision.
Health Risks Associated With BMI Outside the Normal Range
Both high and low BMI are associated with specific health conditions. Understanding these connections explains why doctors use BMI as a first screening step.
Risks associated with high BMI
Type 2 diabetes risk rises substantially above a BMI of 30
High blood pressure and elevated LDL cholesterol
Coronary heart disease and stroke
Obstructive sleep apnoea
Osteoarthritis from excess joint load on hips and knees
Non-alcoholic fatty liver disease
Gallbladder disease
Increased risk of colorectal, breast and endometrial cancer
Risks associated with low BMI
Malnutrition and vitamin deficiencies
Low bone mineral density and increased fracture risk
Impaired immune function and slower recovery from infections
Anaemia from reduced ability to carry oxygen
Hormonal disruption and fertility issues
Slower wound healing and surgical complications
Growth and development issues in teenagers
BMI as a screening tool rather than a diagnosis
Healthcare systems use BMI because it is fast and costs nothing. A single reading outside the normal range does not mean a person is sick. It means they fall into a group that on average has a statistically higher health risk. Whether that risk applies to any given individual requires clinical investigation that includes blood pressure and blood glucose and cholesterol and family history and often body composition assessment.
If your BMI is outside the normal range and you are concerned the right response is to book an appointment with your doctor for a full assessment. Starting a restrictive diet or intense exercise programme based solely on a BMI number is not the recommended approach.
How BMI Reads Differently at Different Ages
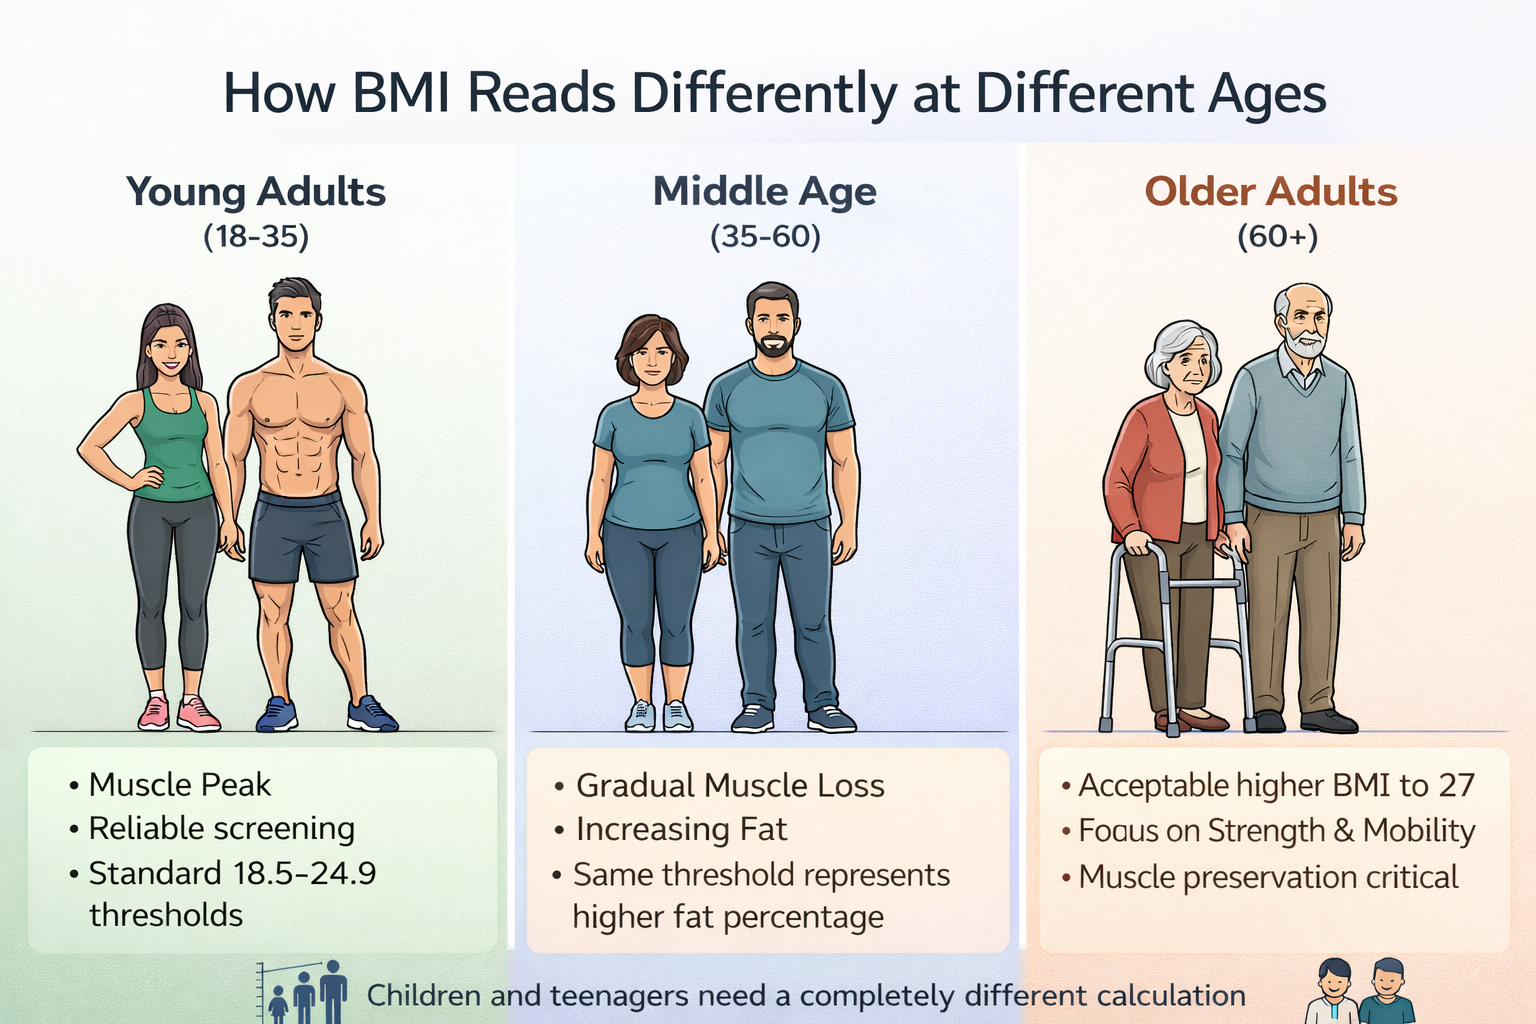
The same BMI number means something quite different at 25 than it does at 60. Body composition shifts substantially throughout life and understanding those changes makes your result more meaningful.
Children and teenagers need a completely different calculation
This calculator is not appropriate for anyone under 18. Children and teenagers are assessed using BMI for age percentile charts because height and body proportions change so rapidly during development that absolute BMI thresholds are meaningless. A number that would indicate underweight in an adult might be entirely normal for a growing 14 year old. For anyone under 18 a paediatrician or school health nurse should apply the correct age-specific and sex-specific growth reference charts published by national health authorities.
Real Life BMI Examples
These examples show what the numbers look like for different body types and how to think through what each result actually means for the person involved.
Questions People Ask About BMI
Detailed answers to the questions that come up most often about what BMI, BMI Prime and the Ponderal Index mean and how to use the results sensibly.
What does BMI actually measure?
BMI measures your weight relative to your height. It divides your weight in kilograms by your height in metres squared and produces a single number that places you in a weight category. What it does not measure is how much of your weight is fat versus muscle versus bone. Two people with identical BMI values can have very different body compositions and very different health risks. Think of it as the initial signal that determines whether a more detailed examination is worthwhile rather than a complete health assessment on its own.
What is BMI Prime and why is it useful?
BMI Prime is your BMI divided by 25. A value of 1.0 means your BMI is exactly at the top of the healthy range. Values below 1.0 are in the normal or underweight zone. Values above 1.0 indicate overweight or obesity. The main advantage of BMI Prime is that it makes it instantly clear how far you are from the healthy boundary. A BMI Prime of 1.20 tells you your BMI is 20 percent above the upper normal limit which is more intuitive than knowing your absolute BMI value of 30 and having to recall where the cutoffs sit.
What is the Ponderal Index and how is it different from BMI?
The Ponderal Index divides weight in kilograms by height in metres cubed rather than squared. Cubing height makes the formula scale more accurately with body volume which means it gives more reliable results for people who are very tall or very short. BMI tends to overestimate body fat for tall people and underestimate it for short people. The normal Ponderal Index range for adults is approximately 11 to 14 kg per cubic metre. For most people of average height both BMI and Ponderal Index tell a similar story. The Ponderal Index is most valuable as a cross-check when someone falls at the extremes of the height range.
What BMI range is considered healthy for adults?
The World Health Organization defines the healthy adult range as 18.5 to 24.9. Below 18.5 is underweight and the WHO further divides this into mild thinness at 17 to 18.5, moderate thinness at 16 to 17, and severe thinness below 16. From 25 to 29.9 is overweight. A BMI of 30 and above is obese and is divided into Class I at 30 to 34.9, Class II at 35 to 39.9, and Class III at 40 and above. These thresholds apply to adults of European descent. For people of South and East Asian descent the WHO recommends lower action points of 23 for overweight and 27.5 for obesity.
Is BMI accurate for athletes and muscular people?
No. Muscle is considerably denser and heavier than fat so athletes and people who train regularly often receive overweight or obese BMI readings despite carrying little excess body fat. A competitive powerlifter or rugby player at peak condition may have a BMI above 30 while being physically very healthy. For people with high muscle mass waist circumference and body fat percentage from bioelectrical impedance or a DEXA scan are far more meaningful measures than BMI or BMI Prime.
What is a healthy BMI for people of Asian descent?
Research consistently shows that adults of East and South Asian descent carry more body fat and face higher risk of type 2 diabetes and cardiovascular disease at any given BMI compared with people of European descent. The WHO has formally stated that action points of 23 for overweight and 27.5 for obesity are more appropriate for these populations. Many health authorities across Asia and in countries with large Asian communities have adopted these lower thresholds. Tick the Asian descent checkbox in this calculator to switch to these adjusted values automatically.
What does waist circumference tell me that BMI does not?
Waist circumference measures the fat stored around your abdomen which is the most metabolically dangerous type of fat. Abdominal fat is more strongly linked to insulin resistance and heart disease than fat stored in the hips or thighs. A large waist can signal elevated health risk even when BMI appears normal. For men a waist above 94 cm signals elevated risk and above 102 cm indicates substantially increased risk. For women the thresholds are 80 cm and 88 cm respectively. Using both waist circumference and BMI together gives a substantially more complete picture than either measurement alone.
Can I use this calculator for a child or teenager?
This calculator uses the standard adult formula which only applies from age 18 onwards. Children and teenagers are assessed using BMI for age percentile charts published by the Centers for Disease Control and Prevention and national health bodies because their height and body proportions change rapidly during development. A number that would indicate underweight in an adult might be entirely normal for a growing 14 year old. For anyone under 18 a paediatrician or school health nurse should apply the correct age-specific growth reference charts.
How can I lower my BMI safely?
The most sustainable approach is losing around 0.5 to 1 kilogram per week through a modest calorie reduction combined with regular physical activity. Walking 30 minutes a day and eating more protein and vegetables are practical starting points that produce consistent results. Very low calorie diets produce rapid initial weight loss but most people regain the weight within one to three years because of the metabolic adaptations triggered by severe restriction. If your BMI is above 30 involving a doctor or registered dietitian is the right starting point for a safe and medically appropriate plan.
Does BMI mean the same thing at 25 as it does at 60?
No. From the mid thirties most adults gradually lose muscle and gain fat even when their weight stays the same on the scale. This means a BMI of 24 at age 60 often represents a higher body fat percentage than the same number did at age 30. Some researchers suggest a BMI up to 27 may be acceptable for adults over 65 because a small reserve of body fat can protect against illness and hospitalisation. For older adults muscle mass and physical strength are often more meaningful health indicators than BMI alone.
Does BMI differ between men and women?
The formula and the category thresholds are identical for both sexes. However at any given BMI value women tend to carry a higher percentage of body fat than men because women have more essential fat and typically less skeletal muscle on average. This means two people with the same BMI number can have meaningfully different body compositions depending on their sex. Body fat percentage measurement is a more direct way to account for these sex-based differences when precision is important.
What is the difference between overweight and the three obesity classes?
Overweight at 25 to 29.9 carries moderately elevated risk for most people. Obese Class I at 30 to 34.9 is linked to high risk of type 2 diabetes and heart disease and typically calls for structured lifestyle intervention. Class II at 35 to 39.9 carries very high risk and usually involves a combination of medical supervision and lifestyle change. Class III at 40 and above carries extremely high risk and is where evidence-based medical options such as pharmacotherapy or bariatric surgery are considered alongside lifestyle intervention.
Why does my result here differ slightly from my doctor's reading?
Small differences almost always come from measurement variation. Clinical measurements are taken without shoes and with light clothing using calibrated stadiometers and scales that are more precise than home equipment. Rounding your height by even one centimetre shifts the BMI by a few tenths. A difference of less than one BMI point between your number and your doctor's is completely normal and falls within standard measurement variation. If the difference is larger it is worth asking your doctor for the exact recorded measurements and re-entering those figures here.
Other Free Calculators
More tools on SaveUpCoupons that work straight away with no account needed.